

অ্যাকচুয়াল প্যাটার্নস

প্যাটার্ন হলো গ্রাফিক্যাল মডেল, যা মূল্য ওঠানামার ভিত্তিতে চার্টে তৈরি হয়। টেকনিক্যাল বিশ্লেষণের নীতি অনুযায়ী, ইতিহাসের (প্রাইস মুভমেন্ট) পুনরাবৃত্তি ঘটে। অর্থাৎ, পরিস্থিতি যদি একই রকম থাকে তাহলে প্রাইস মুভমেন্টও প্রায় একই রকম হয়। এর ফলে মূল্যের ওঠানামা কেমন হবে তা আগেই থেকেই অনুমান করা যায়।
ইন্সটাফরেক্স এর প্রাসঙ্গিক প্যাটার্নসমূহ সহজেই ব্যবহার করা যায়, যার মাধ্যমে মার্কেটের সর্বশেষ পরিস্থিতি জানা যায় এবং তার উপর ভিত্তি করে সিদ্ধান্ত নেওয়া যায়। আমাদের সেবাগুলো থেকে আপনি যেকোনো পেয়ার এবং টাইমফ্রেমের জন্য সর্বশেষ এবং সবচেয়ে প্রাসঙ্গিক প্যাটার্নগুলো খুঁজে পাবেন।
Double Bottom
was formed on 03.04 at 16:59:49 (UTC+0)
signal strength 2 of 5
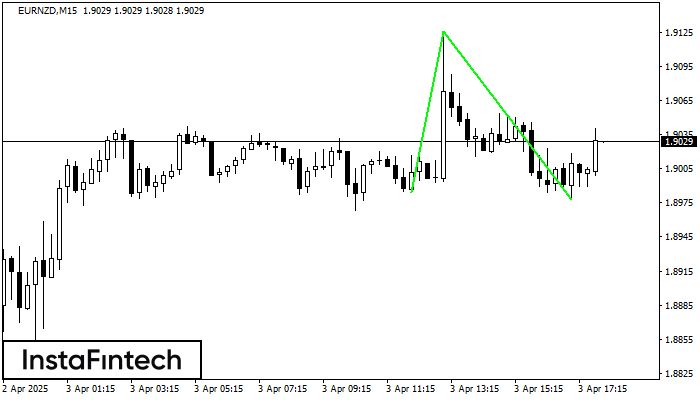
The Double Bottom pattern has been formed on EURNZD M15. Characteristics: the support level 1.8984; the resistance level 1.9126; the width of the pattern 142 points. If the resistance level is broken, a change in the trend can be predicted with the first target point lying at the distance of 148 points.
The M5 and M15 time frames may have more false entry points.
আরও দেখুন
- All
- All
- Bearish Rectangle
- Bearish Symmetrical Triangle
- Bearish Symmetrical Triangle
- Bullish Rectangle
- Double Top
- Double Top
- Triple Bottom
- Triple Bottom
- Triple Top
- Triple Top
- All
- All
- Buy
- Sale
- All
- 1
- 2
- 3
- 4
- 5
বুলিশ রেক্ট্যাঙ্গেল
was formed on 02.06 at 22:15:32 (UTC+0)
signal strength 4 of 5
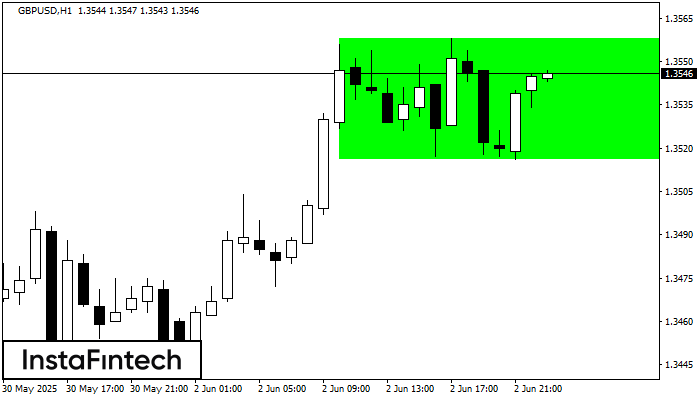
H1 চার্ট অনুযায়ী, GBPUSD বুলিশ রেক্ট্যাঙ্গেল গঠন করেছে। এই প্যাটার্ন এই ধরনের প্রবণতার ধারাবাহিকতার নির্দেশ করে. এটি দুটি স্তর নিয়ে গঠিত: 1.3558 -এর রেজিস্ট্যান্স এবং 1.3516 -এর সাপোর্ট৷ রেজিস্ট্যান্স স্তর
Open chart in a new window
বুলিশ সিমেট্রিকাল ট্রায়াঙ্গেল
was formed on 02.06 at 22:06:22 (UTC+0)
signal strength 1 of 5
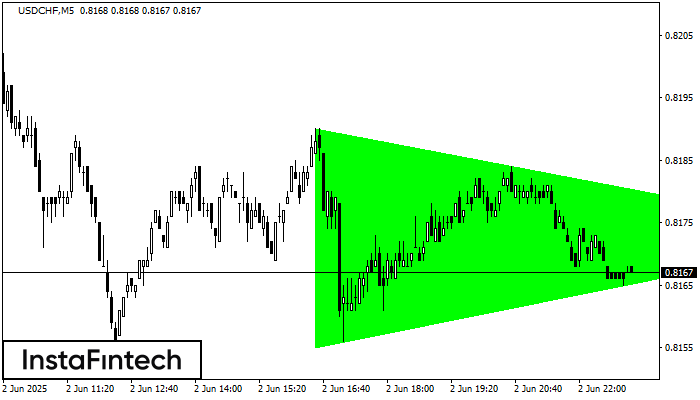
M5 চার্ট অনুসারে, USDCHF বুলিশ সিমেট্রিকাল ট্রায়াঙ্গেল প্যাটার্ন গঠন করেছে, যা চলমান প্রবণতা অব্যাহত থাকবে বলে ইঙ্গিত দিচ্ছে। বর্ণনা: প্যাটার্নের উপরের সীমানা 0.8190/0.8173-এর কোঅর্ডিনেটগুলো স্পর্শ করেছে যেখানে নীচের সীমানা 0.8155/0.8173
M5 এবং M15 টাইম ফ্রেমে আরও ভুল এন্ট্রি পয়েন্ট থাকতে পারে।
Open chart in a new window
বিয়ারিশ সিমেট্রিক্যাল ট্রায়াঙ্গেল
was formed on 02.06 at 21:58:20 (UTC+0)
signal strength 1 of 5
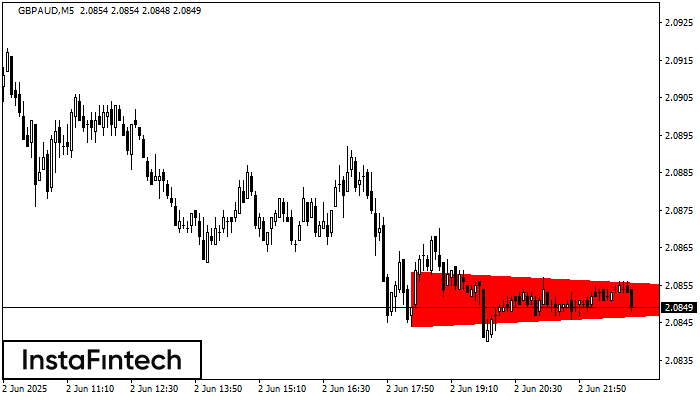
M5 চার্ট অনুযায়ী, GBPAUD বিয়ারিশ সিমেট্রিক্যাল ট্রায়াঙ্গেল প্যাটার্ন গঠন করেছে। বর্ণনা: নীচের সীমানা হচ্ছে 2.0844/2.0851 এবং উপরের সীমানা হল 2.0859/2.0851৷ চার্টে প্যাটার্নের প্রস্থ -15 পিপস বলে পরিমাপ করা হয়েছে। বিয়ারিশ
M5 এবং M15 টাইম ফ্রেমে আরও ভুল এন্ট্রি পয়েন্ট থাকতে পারে।
Open chart in a new window


