

অ্যাকচুয়াল প্যাটার্নস

প্যাটার্ন হলো গ্রাফিক্যাল মডেল, যা মূল্য ওঠানামার ভিত্তিতে চার্টে তৈরি হয়। টেকনিক্যাল বিশ্লেষণের নীতি অনুযায়ী, ইতিহাসের (প্রাইস মুভমেন্ট) পুনরাবৃত্তি ঘটে। অর্থাৎ, পরিস্থিতি যদি একই রকম থাকে তাহলে প্রাইস মুভমেন্টও প্রায় একই রকম হয়। এর ফলে মূল্যের ওঠানামা কেমন হবে তা আগেই থেকেই অনুমান করা যায়।
ইন্সটাফরেক্স এর প্রাসঙ্গিক প্যাটার্নসমূহ সহজেই ব্যবহার করা যায়, যার মাধ্যমে মার্কেটের সর্বশেষ পরিস্থিতি জানা যায় এবং তার উপর ভিত্তি করে সিদ্ধান্ত নেওয়া যায়। আমাদের সেবাগুলো থেকে আপনি যেকোনো পেয়ার এবং টাইমফ্রেমের জন্য সর্বশেষ এবং সবচেয়ে প্রাসঙ্গিক প্যাটার্নগুলো খুঁজে পাবেন।
Head and Shoulders
was formed on 31.03 at 08:30:17 (UTC+0)
signal strength 3 of 5

The technical pattern called Head and Shoulders has appeared on the chart of EURGBP M30. There are weighty reasons to suggest that the price will surpass the Neckline 0.8358/0.8357 after the right shoulder has been formed. So, the trend is set to change with the price heading for 0.8327.
- All
- All
- Bearish Rectangle
- Bearish Symmetrical Triangle
- Bearish Symmetrical Triangle
- Bullish Rectangle
- Double Top
- Double Top
- Triple Bottom
- Triple Bottom
- Triple Top
- Triple Top
- All
- All
- Buy
- Sale
- All
- 1
- 2
- 3
- 4
- 5
ডাবল বটম
was formed on 05.06 at 22:50:11 (UTC+0)
signal strength 1 of 5
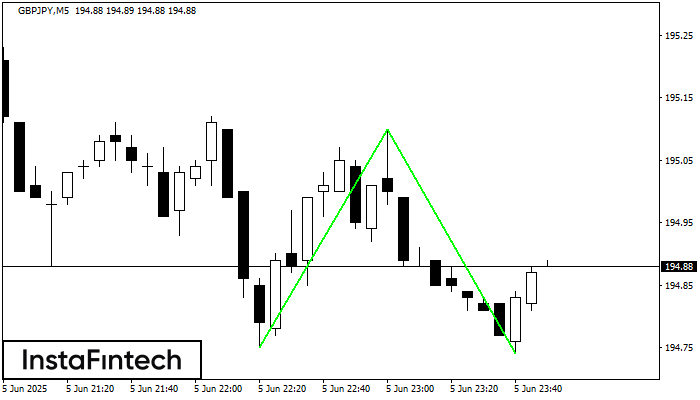
M5 চার্টে, GBPJPY-এর ডাবল বটম প্যাটার্নটি গঠিত হয়েছে। উপরের সীমানা হল 195.10; নীচের সীমানা হল 194.74। প্যাটার্নের প্রস্থ হল 35 পয়েন্ট। 195.10-এর উপরের সীমানা ভেদ করার ক্ষেত্রে, প্রবণতা পরিবর্তনের পূর্বাভাস
M5 এবং M15 টাইম ফ্রেমে আরও ভুল এন্ট্রি পয়েন্ট থাকতে পারে।
Open chart in a new window
ইনভার্স হেড অ্যান্ড শোল্ডার্স
was formed on 05.06 at 21:40:13 (UTC+0)
signal strength 1 of 5

M5 চার্ট অনুযায়ী, #MCD-এর ইনভার্স হেড অ্যান্ড শোল্ডার্স প্যাটার্ন গঠিত হয়েছে। হেড 307.79 -এ নির্ধারণ করা হয়েছে এবং নেকের মিডিয়ান লাইন 308.99/309.18 -এ নির্ধারণ করা হয়েছে। ইনভার্স হেড অ্যান্ড শোল্ডার্স
M5 এবং M15 টাইম ফ্রেমে আরও ভুল এন্ট্রি পয়েন্ট থাকতে পারে।
Open chart in a new window
বিয়ারিশ সিমেট্রিক্যাল ট্রায়াঙ্গেল
was formed on 05.06 at 21:16:00 (UTC+0)
signal strength 1 of 5
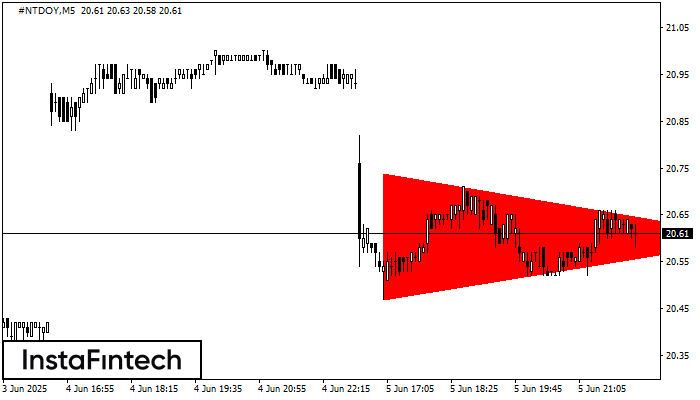
M5 চার্ট অনুযায়ী, #NTDOY বিয়ারিশ সিমেট্রিক্যাল ট্রায়াঙ্গেল প্যাটার্ন গঠন করেছে। বর্ণনা: নীচের সীমানা হচ্ছে 20.47/20.60 এবং উপরের সীমানা হল 20.74/20.60৷ চার্টে প্যাটার্নের প্রস্থ -27 পিপস বলে পরিমাপ করা হয়েছে। বিয়ারিশ
M5 এবং M15 টাইম ফ্রেমে আরও ভুল এন্ট্রি পয়েন্ট থাকতে পারে।
Open chart in a new window

