

অ্যাকচুয়াল প্যাটার্নস

প্যাটার্ন হলো গ্রাফিক্যাল মডেল, যা মূল্য ওঠানামার ভিত্তিতে চার্টে তৈরি হয়। টেকনিক্যাল বিশ্লেষণের নীতি অনুযায়ী, ইতিহাসের (প্রাইস মুভমেন্ট) পুনরাবৃত্তি ঘটে। অর্থাৎ, পরিস্থিতি যদি একই রকম থাকে তাহলে প্রাইস মুভমেন্টও প্রায় একই রকম হয়। এর ফলে মূল্যের ওঠানামা কেমন হবে তা আগেই থেকেই অনুমান করা যায়।
ইন্সটাফরেক্স এর প্রাসঙ্গিক প্যাটার্নসমূহ সহজেই ব্যবহার করা যায়, যার মাধ্যমে মার্কেটের সর্বশেষ পরিস্থিতি জানা যায় এবং তার উপর ভিত্তি করে সিদ্ধান্ত নেওয়া যায়। আমাদের সেবাগুলো থেকে আপনি যেকোনো পেয়ার এবং টাইমফ্রেমের জন্য সর্বশেষ এবং সবচেয়ে প্রাসঙ্গিক প্যাটার্নগুলো খুঁজে পাবেন।
Bearish Symmetrical Triangle
was formed on 25.03 at 21:36:34 (UTC+0)
signal strength 3 of 5
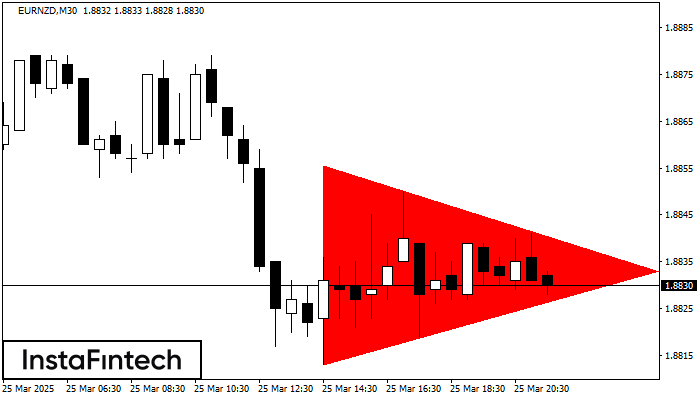
According to the chart of M30, EURNZD formed the Bearish Symmetrical Triangle pattern. This pattern signals a further downward trend in case the lower border 1.8813 is breached. Here, a hypothetical profit will equal the width of the available pattern that is -43 pips.
আরও দেখুন
- All
- All
- Bearish Rectangle
- Bearish Symmetrical Triangle
- Bearish Symmetrical Triangle
- Bullish Rectangle
- Double Top
- Double Top
- Triple Bottom
- Triple Bottom
- Triple Top
- Triple Top
- All
- All
- Buy
- Sale
- All
- 1
- 2
- 3
- 4
- 5
বিয়ারিশ রেক্ট্যাঙ্গেল
was formed on 28.05 at 15:05:49 (UTC+0)
signal strength 1 of 5
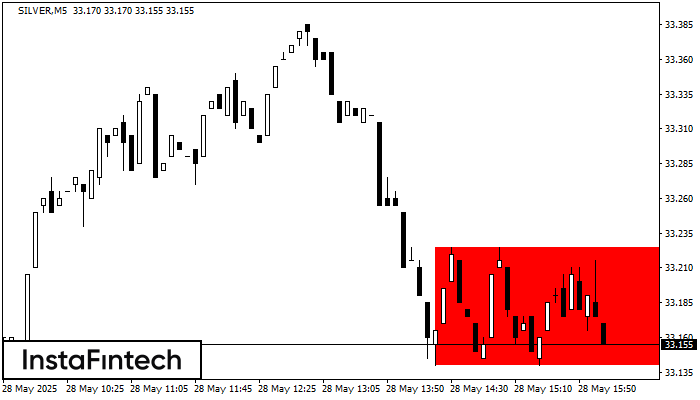
M5 চার্ট অনুযায়ী, SILVER বিয়ারিশ রেক্ট্যাঙ্গেল গঠন করেছে। এই প্যাটার্ন চলমান প্রবণতার ধারাবাহিকতা নির্দেশ করে। উপরের সীমানা হল 33.23, নীচের সীমানা হল 33.14৷ এই সংকেতের অর্থ হল বিয়ারিশ রেক্ট্যাঙ্গেল-এর নীচের
M5 এবং M15 টাইম ফ্রেমে আরও ভুল এন্ট্রি পয়েন্ট থাকতে পারে।
Open chart in a new window
বুলিশ সিমেট্রিকাল ট্রায়াঙ্গেল
was formed on 28.05 at 14:59:02 (UTC+0)
signal strength 2 of 5
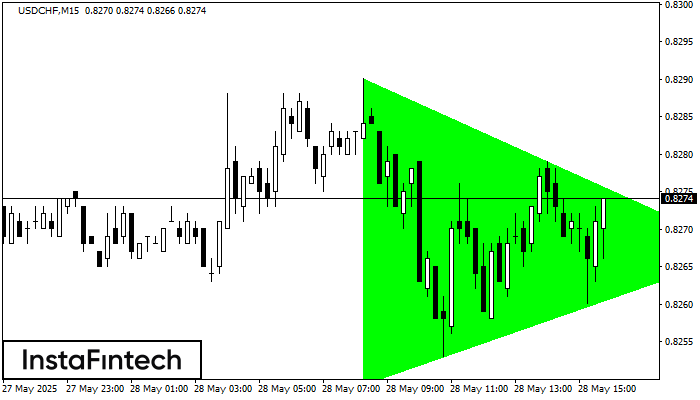
M15 চার্ট অনুসারে, USDCHF বুলিশ সিমেট্রিকাল ট্রায়াঙ্গেল প্যাটার্ন গঠন করেছে, যা চলমান প্রবণতা অব্যাহত থাকবে বলে ইঙ্গিত দিচ্ছে। বর্ণনা: প্যাটার্নের উপরের সীমানা 0.8290/0.8267-এর কোঅর্ডিনেটগুলো স্পর্শ করেছে যেখানে নীচের সীমানা 0.8249/0.8267
M5 এবং M15 টাইম ফ্রেমে আরও ভুল এন্ট্রি পয়েন্ট থাকতে পারে।
Open chart in a new window
ডাবল বটম
was formed on 28.05 at 14:36:46 (UTC+0)
signal strength 1 of 5
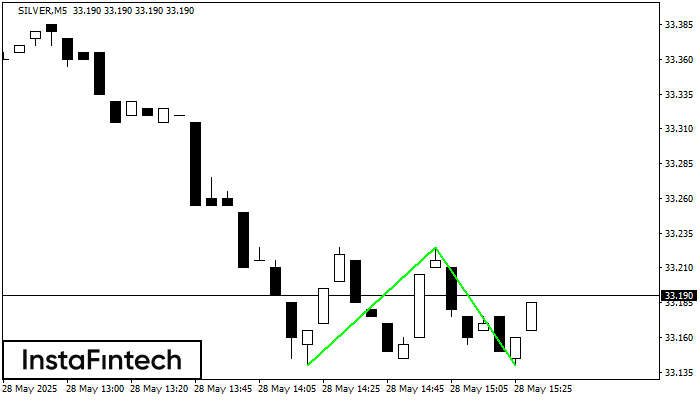
M5 চার্টে, SILVER-এর ডাবল বটম প্যাটার্নটি গঠিত হয়েছে। বৈশিষ্ট্য: সাপোর্ট স্তর হচ্ছে 33.14; রেজিস্ট্যান্স স্তর হচ্ছে 33.23; প্যাটার্নের প্রস্থ হচ্ছে 85 পয়েন্ট। রেজিস্ট্যান্স স্তর ভেদ করা হলে, 85 পয়েন্টের দূরত্বে
M5 এবং M15 টাইম ফ্রেমে আরও ভুল এন্ট্রি পয়েন্ট থাকতে পারে।
Open chart in a new window


