আরও দেখুন


 18.06.2024 05:17 PM
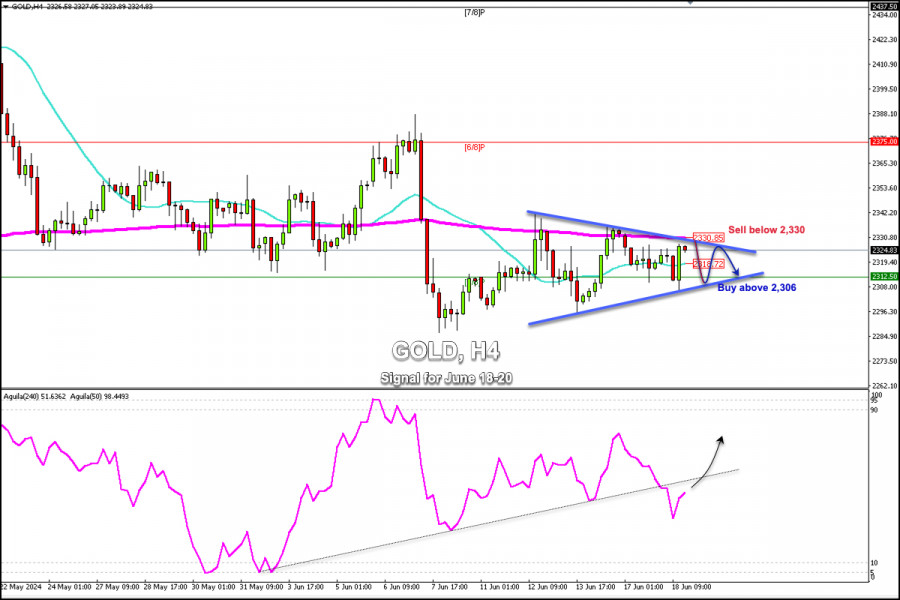
Early in the American session, Gold is trading around 2,324.83 bouncing after having reached a low of around 2,306. The price is now reaching a resistance zone that coincides with the 200 EMA around 2330.
On the H4 chart, we can see that gold is trading within a symmetrical triangle pattern. The metal will likely trade within this pattern in the coming hours and we could expect bearish pressure below 2,330.
In case the XAU/USD trades within the symmetrical triangle pattern and if a technical correction occurs, we could expect a technical bounce of around 2,308 or 2,312. So, we could look for opportunities to buy and sell.
A sharp break of this symmetrical triangle pattern could favor a positive outlook as we see that the eagle indicator is showing a positive signal. Bullish momentum will be confirmed provided that gold consolidates above 2,330 (200 EMA).
On the contrary, a drop and a close below 2,310 on the H4 chart could mean a bearish acceleration. Therefore, gold could fall to the psychological level of 2,300 and even reach the June 7 low of around 2,287.
We must take into account the key levels of 2,330 and 2,312. These levels could offer us some points to sell and buy since gold has been consolidating for almost more than a week. Thus, the odds are there will probably be a sharp break in the coming days.
You have already liked this post today
*এখানে পোস্ট করা মার্কেট বিশ্লেষণ আপনার সচেতনতা বৃদ্ধির জন্য প্রদান করা হয়, ট্রেড করার নির্দেশনা প্রদানের জন্য প্রদান করা হয় না।
মার্কিন সেশনের শুরুতে, স্বর্ণ $3,021 এর আশেপাশে ট্রেড করছে, যে লেভেলটি 21-SMA এর নিচে এবং ১৯ মার্চ থেকে গঠিত হওয়া বিয়ারিশ ট্রেন্ড চ্যানেলের মধ্যে অবস্থিত। H4 চার্টে আমরা দেখতে পাচ্ছি
মার্কিন সেশনের শুরুতে, গোল্ড $3,039 লেভেলের কাছাকাছি ট্রেড করছে, মূল্য +2/8 মারে লেভেলের নিচে অবস্থান করছে এবং ওভারবট লেভেলে পৌঁছেছে। প্রযুক্তিগতভাবে, স্বর্ণের তীব্র দরপতনের সম্ভাবনা রয়েছে। ইউরোপীয় সেশনে, স্বর্ণের মূল্য
মার্কিন সেশনের শুরুতে, স্বর্ণ $2,904-এ ট্রেড করা হচ্ছি, যা ইউরোপিয়ান সেশনে 6/8 মারে ($2,889) টেস্ট করার পর পুনরুদ্ধার করেছে। আগামী কয়েক ঘণ্টার মধ্যে স্বর্ণের মূল্যের ঊর্ধ্বমুখী প্রবণতা বজায় থাকতে পারে
টেকনিক্যালি, স্বর্ণের মূল্য ওভারবট লেভেলে পৌঁছেছে। তবে, আমরা ধারণা করছি যে টেকনিক্যাল কারেকশন আরও কিছু সময়ের জন্য চলতে পারে, যেখানে মূল্য $2,890 (6/8 মারে) এবং 21 SMA লেভেলের কাছাকাছি $2,880-এ
মার্কিন সেশনের শুরুতে, গোল্ড $2,758 এর আশেপাশে ট্রেড করছে, যা 7/8 মারে-এর নিচে এবং জানুয়ারির শুরু থেকে গঠিত আপট্রেন্ড চ্যানেলের মধ্যে রয়েছে। গোল্ডের দরপতনের লক্ষণ দেখা যাচ্ছে। তাই, পরবর্তী কয়েক
Forex Chart
Web-version

Your IP address shows that you are currently located in the USA. If you are a resident of the United States, you are prohibited from using the services of InstaFintech Group including online trading, online transfers, deposit/withdrawal of funds, etc.
If you think you are seeing this message by mistake and your location is not the US, kindly proceed to the website. Otherwise, you must leave the website in order to comply with government restrictions.
Why does your IP address show your location as the USA?
Please confirm whether you are a US resident or not by clicking the relevant button below. If you choose the wrong option, being a US resident, you will not be able to open an account with InstaTrade anyway.
We are sorry for any inconvenience caused by this message.

