

النماذج الفعلية

النماذج هي نماذج رسومية تتشكل في الرسم البياني حسب السعر. وفقا لأحد المسلمات التحليلية الفنية، فإن التاريخ (حركة السعر) يكرر نفسه. ويعني ذلك أن حركات الأسعار غالباً ما تكون متشابهة في نفس الأوضاع مما يجعل من الممكن التنبؤ بزيادة تطوير الوضع الذي يتسم باحتمال كبير.
النماذج ذات الصلة المقدمة من قبل إنستافوركس هي خدمة سهلة الاستخدام تسمح لك بمعرفة التغييرات الأخيرة في السوق والرد على الأدلة من السوق في الوقت المناسب. في خدمتنا، ستجد دائمًا النماذج الأكثر حداثة وملاءمة في أي زوج وأي إطار زمني.
Bearish Flag
was formed on 10.04 at 02:58:24 (UTC+0)
signal strength 1 of 5
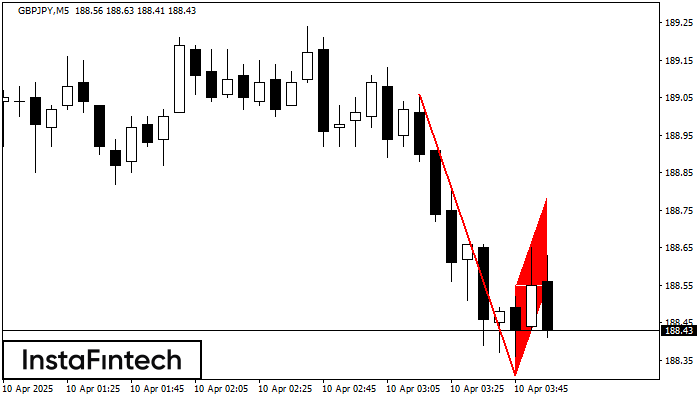
The Bearish Flag pattern has been formed on the chart GBPJPY M5. Therefore, the downwards trend is likely to continue in the nearest term. As soon as the price breaks below the low at 188.31, traders should enter the market.
The M5 and M15 time frames may have more false entry points.
- All
- All
- Bearish Rectangle
- Bearish Symmetrical Triangle
- Bearish Symmetrical Triangle
- Bullish Rectangle
- Double Top
- Double Top
- Triple Bottom
- Triple Bottom
- Triple Top
- Triple Top
- All
- All
- Buy
- Sale
- All
- 1
- 2
- 3
- 4
- 5
Panji Bullish
was formed on 05.06 at 17:30:09 (UTC+0)
signal strength 2 of 5
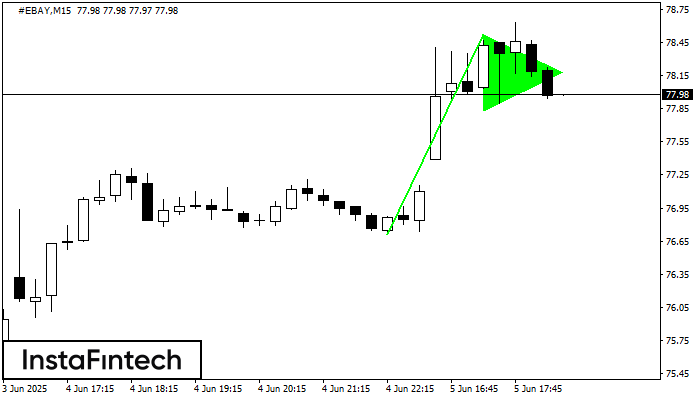
Sinyal Panji Bullish – instrumen trading #EBAY M15, pola kelanjutan. Prakiraan: mungkin untuk mengatur posisi beli di atas titik tertinggi pola, di 78.52, dengan prospek pergerakan selanjutnya menjadi proyeksi titik
Rangka waktu M5 dan M15 mungkin memiliki lebih dari titik entri yang keliru.
Open chart in a new window
Panji Bearish
was formed on 05.06 at 16:45:18 (UTC+0)
signal strength 2 of 5

Pola Panji Bearish telah terbentuk di grafik #TSLA M15. Jenis pola ini memiliki ciri sedikit perlambatan yang setelahnya harga akan bergerak ke arah tren sebenarnya. Jika harga ditetapkan di bawah
Rangka waktu M5 dan M15 mungkin memiliki lebih dari titik entri yang keliru.
Open chart in a new window
Panji Bearish
was formed on 05.06 at 16:45:10 (UTC+0)
signal strength 2 of 5
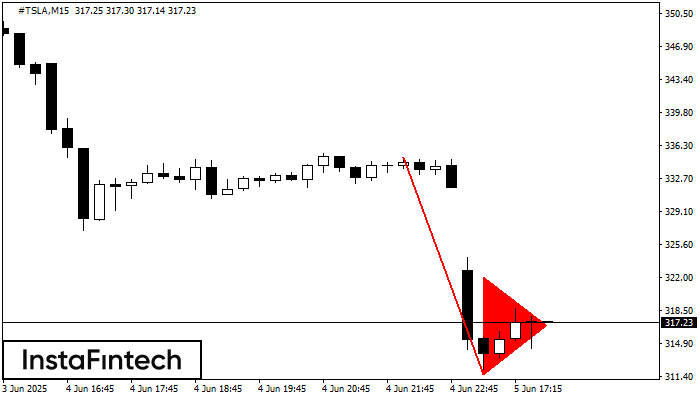
Pola Panji Bearish telah terbentuk di grafik #TSLA M15. Pola ini memberikan sinyal potensi kelanjutan tren yang ada. Spesifikasi: titik terendah pola berkoordinat di 311.59; proyeksi titik tertinggi sama dengan
Rangka waktu M5 dan M15 mungkin memiliki lebih dari titik entri yang keliru.
Open chart in a new window


