

النماذج الفعلية

النماذج هي نماذج رسومية تتشكل في الرسم البياني حسب السعر. وفقا لأحد المسلمات التحليلية الفنية، فإن التاريخ (حركة السعر) يكرر نفسه. ويعني ذلك أن حركات الأسعار غالباً ما تكون متشابهة في نفس الأوضاع مما يجعل من الممكن التنبؤ بزيادة تطوير الوضع الذي يتسم باحتمال كبير.
النماذج ذات الصلة المقدمة من قبل إنستافوركس هي خدمة سهلة الاستخدام تسمح لك بمعرفة التغييرات الأخيرة في السوق والرد على الأدلة من السوق في الوقت المناسب. في خدمتنا، ستجد دائمًا النماذج الأكثر حداثة وملاءمة في أي زوج وأي إطار زمني.
Double Top
was formed on 09.04 at 21:50:18 (UTC+0)
signal strength 1 of 5
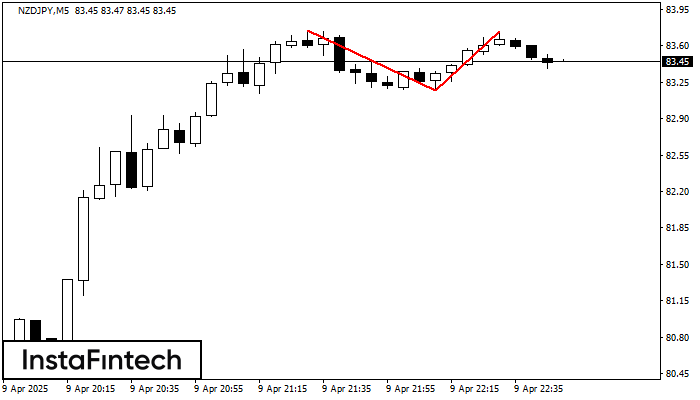
The Double Top reversal pattern has been formed on NZDJPY M5. Characteristics: the upper boundary 83.75; the lower boundary 83.17; the width of the pattern is 57 points. Sell trades are better to be opened below the lower boundary 83.17 with a possible movements towards the 83.02 level.
The M5 and M15 time frames may have more false entry points.
انظر أيضا
- All
- All
- Bearish Rectangle
- Bearish Symmetrical Triangle
- Bearish Symmetrical Triangle
- Bullish Rectangle
- Double Top
- Double Top
- Triple Bottom
- Triple Bottom
- Triple Top
- Triple Top
- All
- All
- Buy
- Sale
- All
- 1
- 2
- 3
- 4
- 5
Голова и плечи
сформирован 05.06 в 04:45:35 (UTC+0)
сила сигнала 1 из 5
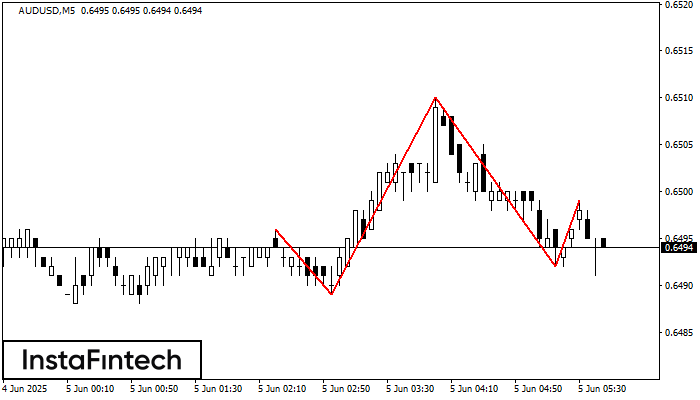
Графическая фигура «Голова и плечи» сформировалась по инструменту AUDUSD на M5. Вероятно предполагать, что после формирования правого плеча цена преодолеет уровень шеи 0.6489/0.6492, изменяя тем самым тенденцию и фактически направляя
Таймфреймы М5 и М15 могут иметь больше ложных точек входа.
Открыть график инструмента в новом окне
Прямоугольник
сформирован 05.06 в 04:06:17 (UTC+0)
сила сигнала 2 из 5

Сформирована фигура «Прямоугольник» на графике EURCHF M15. Тип фигуры: Продолжение тренда; Границы: Верхняя 0.9348, Нижняя 0.9337; Сигнал: позиция на продажу открывается после фиксации цены ниже границы прямоугольника 0.9337
Таймфреймы М5 и М15 могут иметь больше ложных точек входа.
Открыть график инструмента в новом окне
Двойная вершина
сформирован 05.06 в 04:00:46 (UTC+0)
сила сигнала 3 из 5
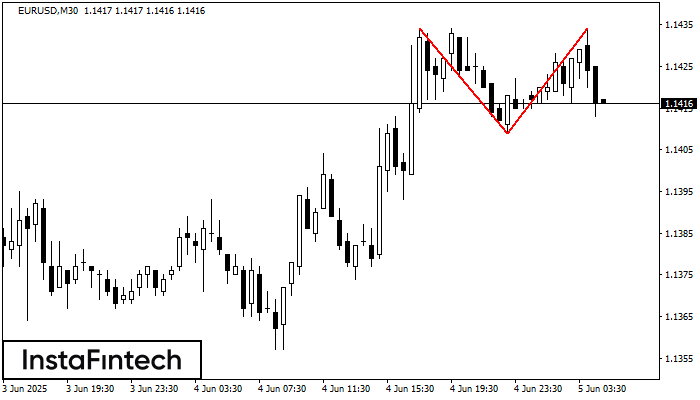
По торговому инструменту EURUSD на M30 сформировалась фигура «Двойная вершина», которая сигнализирует нам об изменении тенденции с восходящей на нисходящую. Вероятно, что, в случае пробоя основания фигуры 1.1409, возможно дальнейшее
Открыть график инструмента в новом окне


