

النماذج الفعلية

النماذج هي نماذج رسومية تتشكل في الرسم البياني حسب السعر. وفقا لأحد المسلمات التحليلية الفنية، فإن التاريخ (حركة السعر) يكرر نفسه. ويعني ذلك أن حركات الأسعار غالباً ما تكون متشابهة في نفس الأوضاع مما يجعل من الممكن التنبؤ بزيادة تطوير الوضع الذي يتسم باحتمال كبير.
النماذج ذات الصلة المقدمة من قبل إنستافوركس هي خدمة سهلة الاستخدام تسمح لك بمعرفة التغييرات الأخيرة في السوق والرد على الأدلة من السوق في الوقت المناسب. في خدمتنا، ستجد دائمًا النماذج الأكثر حداثة وملاءمة في أي زوج وأي إطار زمني.
Bullish Symmetrical Triangle
was formed on 08.04 at 08:31:09 (UTC+0)
signal strength 1 of 5
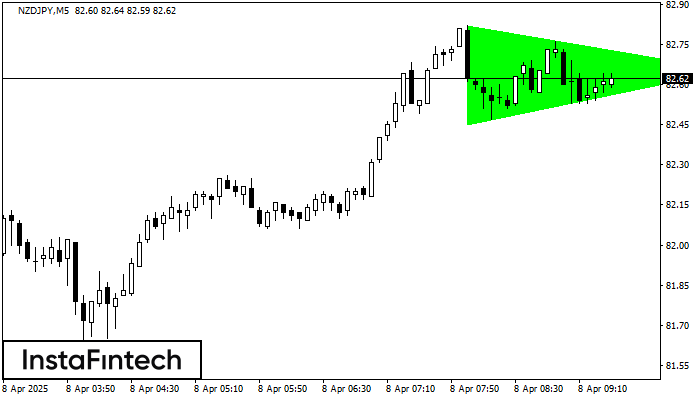
According to the chart of M5, NZDJPY formed the Bullish Symmetrical Triangle pattern. Description: This is the pattern of a trend continuation. 82.82 and 82.45 are the coordinates of the upper and lower borders respectively. The pattern width is measured on the chart at 37 pips. Outlook: If the upper border 82.82 is broken, the price is likely to continue its move by 82.80.
The M5 and M15 time frames may have more false entry points.
- All
- All
- Bearish Rectangle
- Bearish Symmetrical Triangle
- Bearish Symmetrical Triangle
- Bullish Rectangle
- Double Top
- Double Top
- Triple Bottom
- Triple Bottom
- Triple Top
- Triple Top
- All
- All
- Buy
- Sale
- All
- 1
- 2
- 3
- 4
- 5
Pennant Aliran Menurun
was formed on 02.06 at 09:40:38 (UTC+0)
signal strength 1 of 5
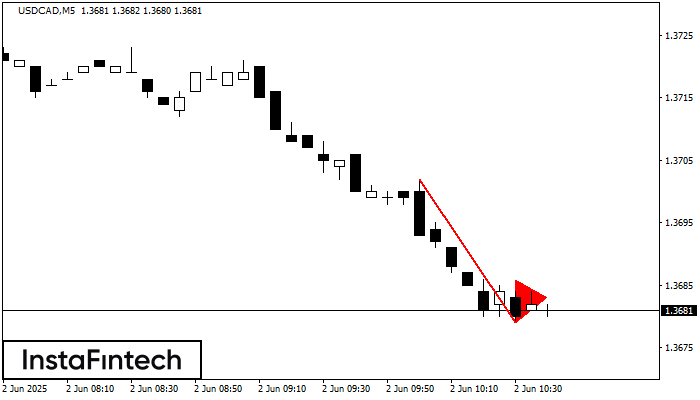
Corak Pennant Aliran Menurun telah dibentuk pada carta USDCAD M5. Ia menandakan potensi kesinambungan aliran yang sedia ada. Spesifikasi: bahagian corak mempunyai koordinat 1.3679; unjuran ketinggian flagpole adalah sama dengan
Carta masa M5 dan M15 mungkin mempunyai lebih banyak titik kemasukan palsu.
Open chart in a new window
Segi Tiga Simetri Menaik
was formed on 02.06 at 09:22:12 (UTC+0)
signal strength 4 of 5

Berdasarkan carta H1, EURJPY membentuk corak Segi Tiga Simetri Menaik. Sempadan yang lebih rendah bagi corak yang menyentuh koordinat 162.28/163.37 di mana sempadan atas merentasi 164.23/163.37. Sekiranya corak Segi Tiga
Open chart in a new window
Double Bottom
was formed on 02.06 at 09:00:13 (UTC+0)
signal strength 3 of 5

Corak Double Bottom telah dibentuk pada GBPJPY M30. Ciri-ciri: tahap sokongan 193.37; tahap rintangan 194.63; lebar corak 126 mata. Sekiranya tahap rintangan ditembusi, perubahan aliran boleh diramalkan dengan titik sasaran
Open chart in a new window


