

النماذج الفعلية

النماذج هي نماذج رسومية تتشكل في الرسم البياني حسب السعر. وفقا لأحد المسلمات التحليلية الفنية، فإن التاريخ (حركة السعر) يكرر نفسه. ويعني ذلك أن حركات الأسعار غالباً ما تكون متشابهة في نفس الأوضاع مما يجعل من الممكن التنبؤ بزيادة تطوير الوضع الذي يتسم باحتمال كبير.
النماذج ذات الصلة المقدمة من قبل إنستافوركس هي خدمة سهلة الاستخدام تسمح لك بمعرفة التغييرات الأخيرة في السوق والرد على الأدلة من السوق في الوقت المناسب. في خدمتنا، ستجد دائمًا النماذج الأكثر حداثة وملاءمة في أي زوج وأي إطار زمني.
Triple Top
was formed on 07.04 at 06:30:25 (UTC+0)
signal strength 1 of 5
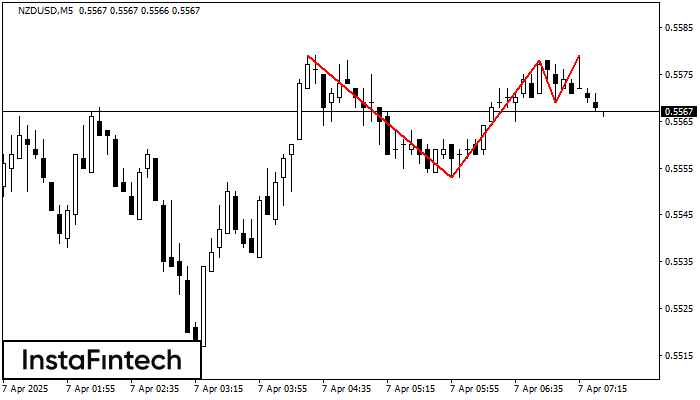
The Triple Top pattern has formed on the chart of the NZDUSD M5. Features of the pattern: borders have an ascending angle; the lower line of the pattern has the coordinates 0.5553/0.5569 with the upper limit 0.5579/0.5579; the projection of the width is 26 points. The formation of the Triple Top figure most likely indicates a change in the trend from upward to downward. This means that in the event of a breakdown of the support level of 0.5553, the price is most likely to continue the downward movement.
The M5 and M15 time frames may have more false entry points.
- All
- All
- Bearish Rectangle
- Bearish Symmetrical Triangle
- Bearish Symmetrical Triangle
- Bullish Rectangle
- Double Top
- Double Top
- Triple Bottom
- Triple Bottom
- Triple Top
- Triple Top
- All
- All
- Buy
- Sale
- All
- 1
- 2
- 3
- 4
- 5
Head dan Shoulders
was formed on 17.04 at 14:00:03 (UTC+0)
signal strength 2 of 5

Corak teknikal yang dipanggil Head dan Shoulders telah muncul pada carta EURCHF M15. Terdapat alasan yang berat untuk menunjukkan bahawa harga akan mengatasi garisan Neck 0.9278/0.9279 selepas Shoulder kanan telah
Carta masa M5 dan M15 mungkin mempunyai lebih banyak titik kemasukan palsu.
Open chart in a new window
Segi Tiga Simetri Menurun
was formed on 17.04 at 13:58:48 (UTC+0)
signal strength 1 of 5

Berdasarkan carta M5, GBPUSD membentuk corak Segi Tiga Simetri Menurun. Cadangan dagangan: Penembusan sempadan bawah 1.3203 mungkin mendorong kepada kesinambungan aliran menurun
Carta masa M5 dan M15 mungkin mempunyai lebih banyak titik kemasukan palsu.
Open chart in a new window
Segi Tiga Simetri Menurun
was formed on 17.04 at 13:57:41 (UTC+0)
signal strength 3 of 5

Berdasarkan carta M30, EURUSD membentuk corak Segi Tiga Simetri Menurun. Corak ini menandakan aliran menurun lagi dalam situasi sempadan rendah 1.1264 ditembusi. Di sini, keuntungan andaian akan sepadan dengan lebar
Open chart in a new window


