

النماذج الفعلية

النماذج هي نماذج رسومية تتشكل في الرسم البياني حسب السعر. وفقا لأحد المسلمات التحليلية الفنية، فإن التاريخ (حركة السعر) يكرر نفسه. ويعني ذلك أن حركات الأسعار غالباً ما تكون متشابهة في نفس الأوضاع مما يجعل من الممكن التنبؤ بزيادة تطوير الوضع الذي يتسم باحتمال كبير.
النماذج ذات الصلة المقدمة من قبل إنستافوركس هي خدمة سهلة الاستخدام تسمح لك بمعرفة التغييرات الأخيرة في السوق والرد على الأدلة من السوق في الوقت المناسب. في خدمتنا، ستجد دائمًا النماذج الأكثر حداثة وملاءمة في أي زوج وأي إطار زمني.
Triple Bottom
was formed on 07.04 at 03:10:11 (UTC+0)
signal strength 1 of 5

The Triple Bottom pattern has been formed on GOLD M5. It has the following characteristics: resistance level 3009.08/2992.38; support level 2976.74/2972.63; the width is 3234 points. In the event of a breakdown of the resistance level of 3009.08, the price is likely to continue an upward movement at least to 2971.02.
The M5 and M15 time frames may have more false entry points.
- All
- All
- Bearish Rectangle
- Bearish Symmetrical Triangle
- Bearish Symmetrical Triangle
- Bullish Rectangle
- Double Top
- Double Top
- Triple Bottom
- Triple Bottom
- Triple Top
- Triple Top
- All
- All
- Buy
- Sale
- All
- 1
- 2
- 3
- 4
- 5
รูปแบบกราฟจุดสองยอดขาลง (Double Bottom)
was formed on 02.06 at 11:10:02 (UTC+0)
signal strength 1 of 5
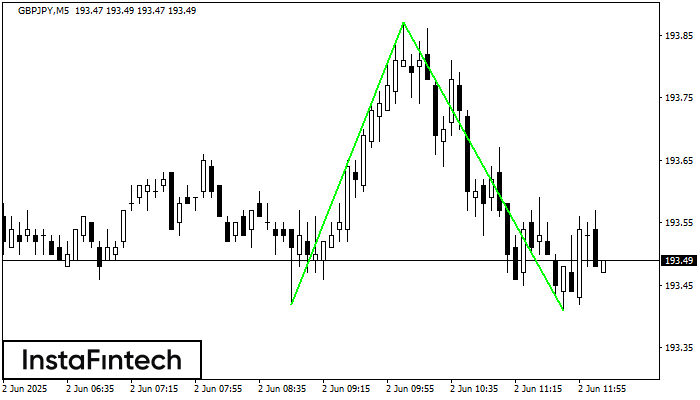
รูปแบบ รูปแบบกราฟจุดสองยอดขาลง (Double Bottom) ถูกสร้างขึ้นมาใน GBPJPY M5 คุณลักษณะ: ระดับของแนวรับ 193.42; ระดับของแนวต้าน 193.87; ความกว้างของรูปแบบ 45 จุด
ขอบเตระยะเวลาใน M5 และ M15 อาจจะมีตำแหน่งการเข้าใช้งานที่ผิดพลาดมากยิ่งขึ้น
Open chart in a new window
รูปแบบกราฟธงปลายแหลมขาลง (Bearish pennant)
was formed on 02.06 at 09:40:38 (UTC+0)
signal strength 1 of 5
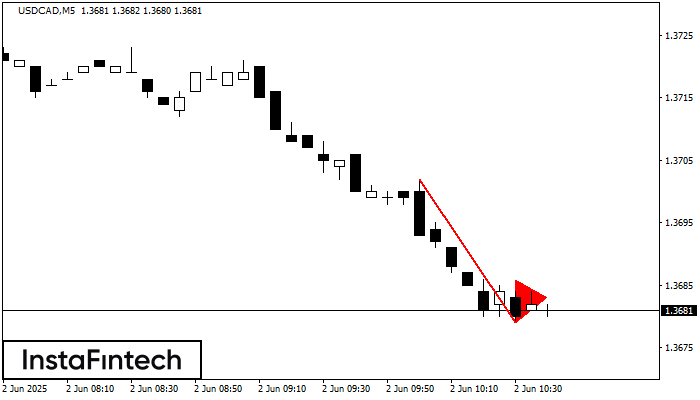
รูปแบบ รูปแบบกราฟธงปลายแหลมขาลง (Bearish pennant) ได้สร้างขึ้นมาในชาร์ต USDCAD M5 มันแสดงถึงความต่อเนื่องของแนวโน้มปัจจุบัน คุณลักษณะจำเพาะ: ระดับต่ำของรูปแบบนี้จะเป็นพิกัดของ 1.3679;การประมาณการความสูงของตัวเสาธง เท่ากับ 23 บี๊ป ในกรณีที่ราคาเคลื่อนตัวทะลุผ่านระดับต่ำของรูปแบบนี้ที่
ขอบเตระยะเวลาใน M5 และ M15 อาจจะมีตำแหน่งการเข้าใช้งานที่ผิดพลาดมากยิ่งขึ้น
Open chart in a new window
รูปแบบสามเหลี่ยมสมมาตรขาขึ้น (Bullish Symmetrical Triangle)
was formed on 02.06 at 09:22:12 (UTC+0)
signal strength 4 of 5

อ้างอิงจากชาร์ตของ H1, EURJPY ที่ได้สร้างรูปแบบ รูปแบบสามเหลี่ยมสมมาตรขาขึ้น (Bullish Symmetrical Triangle) ออกมา ขอบเขตด้านล่างของรูปแบบสัมผัสพิกัด 162.28/163.37 แม้ว่าขอบเขตด้านบนจะข้ามผ่าน 164.23/163.37 ถ้ารูปแบบ รูปแบบสามเหลี่ยมสมมาตรขาขึ้น
Open chart in a new window


