

النماذج الفعلية

النماذج هي نماذج رسومية تتشكل في الرسم البياني حسب السعر. وفقا لأحد المسلمات التحليلية الفنية، فإن التاريخ (حركة السعر) يكرر نفسه. ويعني ذلك أن حركات الأسعار غالباً ما تكون متشابهة في نفس الأوضاع مما يجعل من الممكن التنبؤ بزيادة تطوير الوضع الذي يتسم باحتمال كبير.
النماذج ذات الصلة المقدمة من قبل إنستافوركس هي خدمة سهلة الاستخدام تسمح لك بمعرفة التغييرات الأخيرة في السوق والرد على الأدلة من السوق في الوقت المناسب. في خدمتنا، ستجد دائمًا النماذج الأكثر حداثة وملاءمة في أي زوج وأي إطار زمني.
Triple Bottom
was formed on 07.04 at 02:30:15 (UTC+0)
signal strength 1 of 5
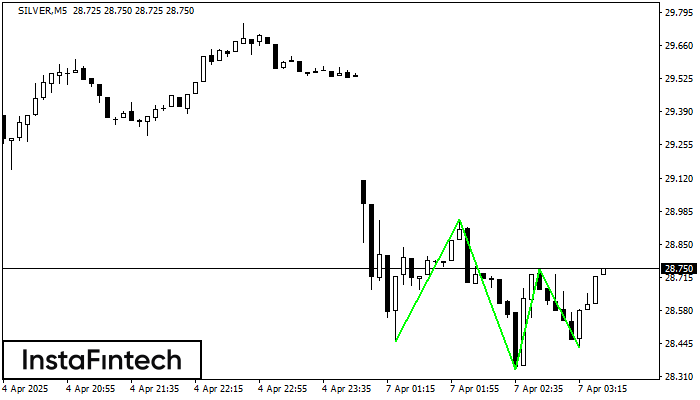
The Triple Bottom pattern has formed on the chart of SILVER M5. Features of the pattern: The lower line of the pattern has coordinates 28.95 with the upper limit 28.95/28.75, the projection of the width is 495 points. The formation of the Triple Bottom pattern most likely indicates a change in the trend from downward to upward. This means that in the event of a breakdown of the resistance level 28.45, the price is most likely to continue the upward movement.
The M5 and M15 time frames may have more false entry points.
- All
- All
- Bearish Rectangle
- Bearish Symmetrical Triangle
- Bearish Symmetrical Triangle
- Bullish Rectangle
- Double Top
- Double Top
- Triple Bottom
- Triple Bottom
- Triple Top
- Triple Top
- All
- All
- Buy
- Sale
- All
- 1
- 2
- 3
- 4
- 5
Đỉnh đôi
was formed on 04.06 at 04:00:27 (UTC+0)
signal strength 3 of 5
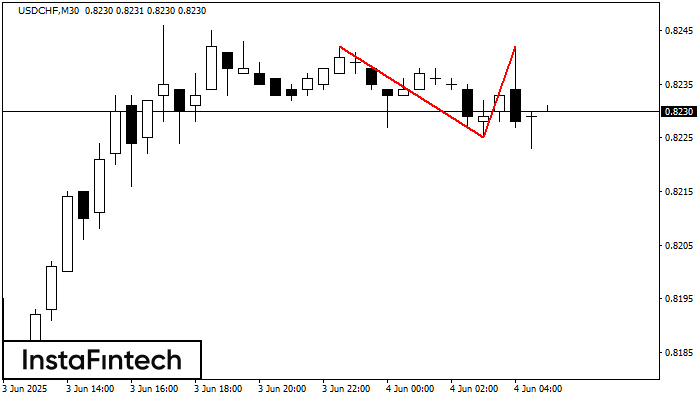
Mô hình đảo chiều Đỉnh đôi đã được hình thành trên USDCHF M30. Đặc điểm: ranh giới trên 0.8242; ranh giới dưới 0.8225; chiều rộng của mô hình
Open chart in a new window
Đỉnh ba
was formed on 04.06 at 04:00:18 (UTC+0)
signal strength 3 of 5
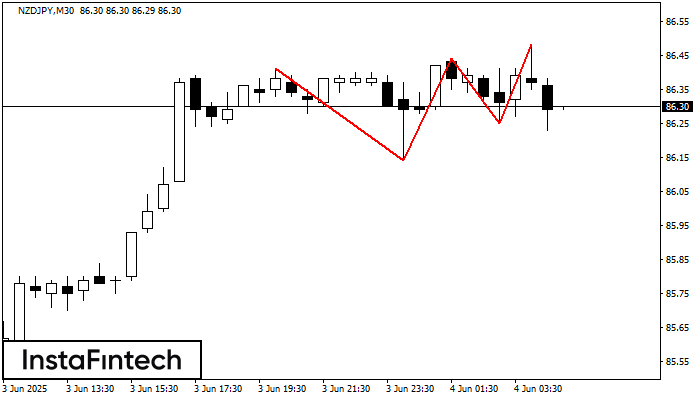
Mô hình Đỉnh ba đã được hình thành trên biểu đồ của công cụ giao dịch NZDJPY M30. Đó là mô hình đảo chiều có các đặc điểm
Open chart in a new window
Đỉnh đôi
was formed on 04.06 at 03:30:07 (UTC+0)
signal strength 3 of 5
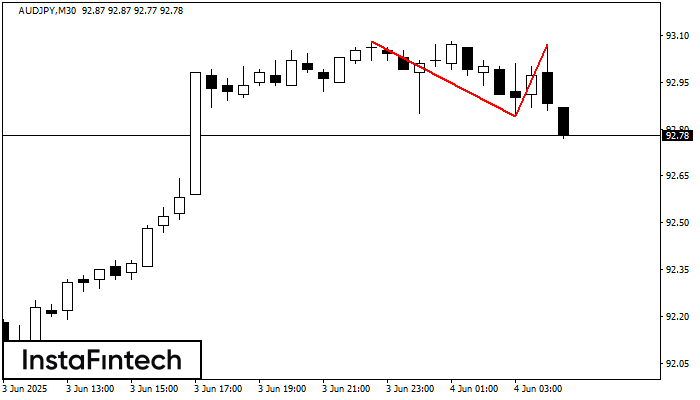
Trên biểu đồ AUDJPY M30, mô hình đảo chiều Đỉnh đôi đã được hình thành. Đặc điểm: ranh giới trên ở 93.07; ranh giới dưới ở 92.84; chiều rộng
Open chart in a new window


