

النماذج الفعلية

النماذج هي نماذج رسومية تتشكل في الرسم البياني حسب السعر. وفقا لأحد المسلمات التحليلية الفنية، فإن التاريخ (حركة السعر) يكرر نفسه. ويعني ذلك أن حركات الأسعار غالباً ما تكون متشابهة في نفس الأوضاع مما يجعل من الممكن التنبؤ بزيادة تطوير الوضع الذي يتسم باحتمال كبير.
النماذج ذات الصلة المقدمة من قبل إنستافوركس هي خدمة سهلة الاستخدام تسمح لك بمعرفة التغييرات الأخيرة في السوق والرد على الأدلة من السوق في الوقت المناسب. في خدمتنا، ستجد دائمًا النماذج الأكثر حداثة وملاءمة في أي زوج وأي إطار زمني.
Inverse Head and Shoulder
was formed on 27.03 at 09:00:09 (UTC+0)
signal strength 3 of 5
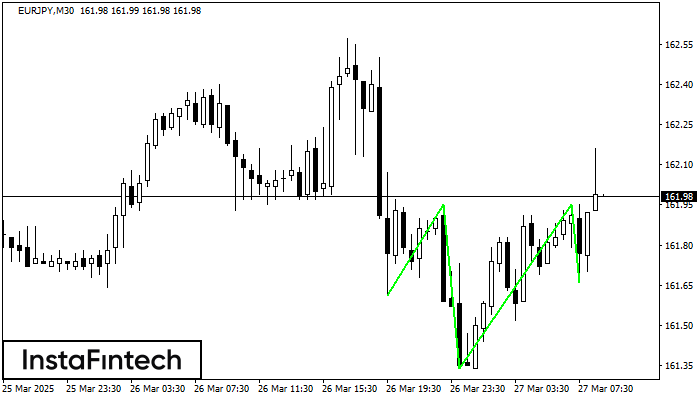
According to M30, EURJPY is shaping the technical pattern – the Inverse Head and Shoulder. In case the Neckline 161.95/161.95 is broken out, the instrument is likely to move toward 162.25.
انظر أيضا
- All
- All
- Bearish Rectangle
- Bearish Symmetrical Triangle
- Bearish Symmetrical Triangle
- Bullish Rectangle
- Double Top
- Double Top
- Triple Bottom
- Triple Bottom
- Triple Top
- Triple Top
- All
- All
- Buy
- Sale
- All
- 1
- 2
- 3
- 4
- 5
Inverse Head and Shoulder
was formed on 05.06 at 21:40:13 (UTC+0)
signal strength 1 of 5

According to the chart of M5, #MCD produced the pattern termed the Inverse Head and Shoulder. The Head is fixed at 307.79 while the median line of the Neck
The M5 and M15 time frames may have more false entry points.
Open chart in a new window
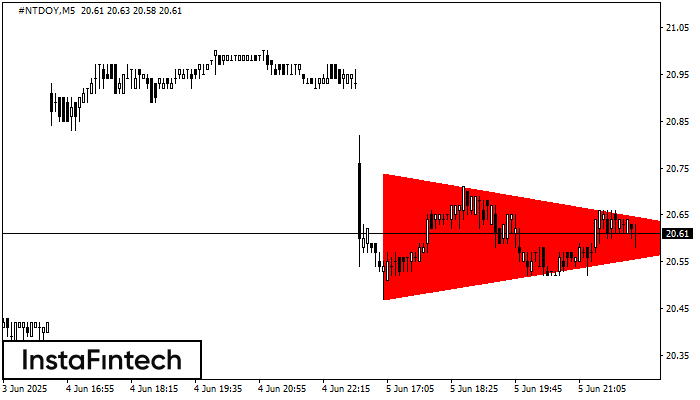
Bearish Symmetrical Triangle
was formed on 05.06 at 21:16:00 (UTC+0)
signal strength 1 of 5

According to the chart of M5, #NTDOY formed the Bearish Symmetrical Triangle pattern. Description: The lower border is 20.47/20.60 and upper border is 20.74/20.60. The pattern width is measured
The M5 and M15 time frames may have more false entry points.
Open chart in a new window
Bearish Symmetrical Triangle
was formed on 05.06 at 21:15:52 (UTC+0)
signal strength 1 of 5
According to the chart of M5, #NTDOY formed the Bearish Symmetrical Triangle pattern. Trading recommendations: A breach of the lower border 20.47 is likely to encourage a continuation
The M5 and M15 time frames may have more false entry points.
Open chart in a new window


