
 31.10.2022 11:20 AM
BITCOIN
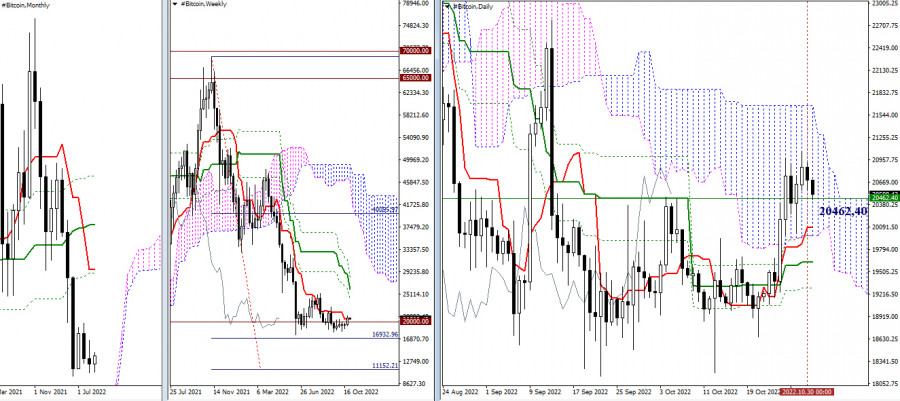
Following a bull run to 65,000, BTC failed to reach 70,000 and went deep down. Amid the increased bearish activity, a reversal took place. Ichimoku crosses saw changes in the weekly and monthly time frames. In addition, the weekly Cloud was broken and a bearish target formed. The targets at 16933 and 11152 are now seen as important barriers for the downtrend to extend. However, bitcoin is currently consolidating around the psychological support level of 20,000. Should the bears push the price further down, the bulls consolidate above the weekly short-term trend (20,462.40) and BTC leave the daily Cloud and enter a bullish zone, the target would stand at 24,043.77. The price would hit the target in case of a breakout through the daily Ichimoku Cloud and the resistance of the weekly Cross.
H4-H1
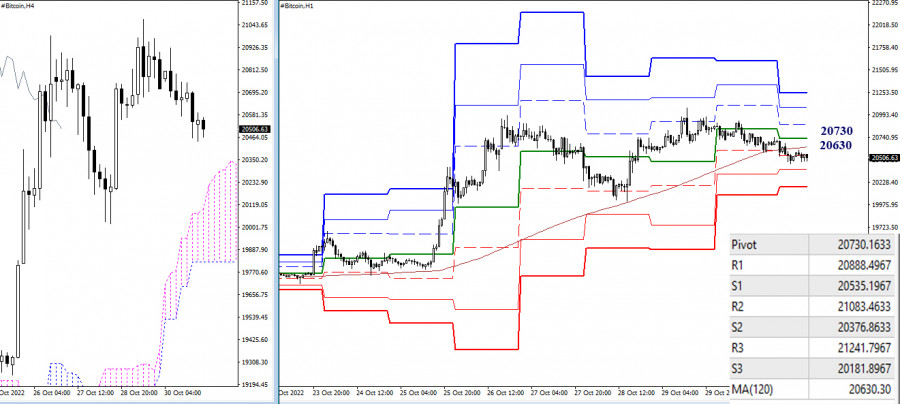
In the lower time frames, the downtrend is getting deeper. The bears are now active below the key levels of 20,630 – 20,730 (weekly long-term trend + central Pivot level). The downtrend would extend should bearish sentiment increase. The nearest intraday support levels are seen at 20,376.86 and 20,181.90 (classic Pivot levels). If BTC returns to the key levels of the lower time frames (20,630 – 20,730), the targets will stand at 20,888.50 – 21,083.46 – 21,241.80, in line with classic Pivot resistance.
***
Indicators used in technical analysis:
Higher time frames – Ichimoku Kinko Hyo (9.26.52) + Fibo Kijun
H1 – Pivot Points (classic) + Moving Average (120) (weekly long-term trend)
You have already liked this post today
*The market analysis posted here is meant to increase your awareness, but not to give instructions to make a trade.
روابط مفيدة: مقالاتي الأخرى متوفرة في هذا القسم دورة InstaForex للمبتدئين التحليلات الشائعة افتح حساب تداول مهم: يجب على المبتدئين في تداول الفوركس أن يكونوا حذرين للغاية عند اتخاذ قرارات
روابط مفيدة: مقالاتي الأخرى متوفرة في هذا القسم دورة InstaForex للمبتدئين التحليلات الشائعة افتح حساب تداول مهم: يجب على المبتدئين في تداول الفوركس أن يكونوا حذرين للغاية عند اتخاذ القرارات
مع ظهور نماذج الوتد المتسع المتباين والهابط على الرسم البياني لمدة 4 ساعات لزوج العملات المتقاطع AUD/JPY، على الرغم من أن حركة السعر تقع تحت المتوسط المتحرك الأسي (21) الذي
على الرسم البياني لمدة 4 ساعات للزوج الرئيسي USD/JPY، يمكن ملاحظة أن مؤشر Stochastic Oscillator يشكل نمط القاع المزدوج بينما يشكل حركة سعر USD/JPY قمة أعلى، مما يعطي هذا التباين
خطة التداول لدينا للساعات القادمة هي البيع تحت مستوى 1.1410 مع أهداف عند 1.1370 و1.1230. مؤشر النسر يعطي إشارة سلبية، لذلك نعتقد أن تصحيحًا تقنيًا قد يحدث على المدى القصير
روابط مفيدة: مقالاتي الأخرى متوفرة في هذا القسم دورة InstaForex للمبتدئين التحليلات الشائعة افتح حساب تداول مهم: يجب على المبتدئين في تداول الفوركس أن يكونوا حذرين للغاية عند اتخاذ القرارات
من ناحية أخرى، إذا ساد الضغط الهبوطي واستقر اليورو تحت مستوى 1.1370، فقد يُعتبر ذلك إشارة بيع مع أهداف عند مستوى 6/8 Murray الموجود عند 1.1230 وفي النهاية
في بداية الجلسة الأمريكية، يتداول الذهب حول 3,299 ضمن قناة الاتجاه الهابط التي تتشكل منذ 21 أبريل، مما يظهر تعافيًا فوق الدعم عند 3,270. على الرسم البياني H4، يمكننا رؤية
فيراري إف8 تريبوتو
من إنستافوركس
شارت الفوركس
على شبكة الانترنت

Your IP address shows that you are currently located in the USA. If you are a resident of the United States, you are prohibited from using the services of InstaFintech Group including online trading, online transfers, deposit/withdrawal of funds, etc.
If you think you are seeing this message by mistake and your location is not the US, kindly proceed to the website. Otherwise, you must leave the website in order to comply with government restrictions.
Why does your IP address show your location as the USA?
Please confirm whether you are a US resident or not by clicking the relevant button below. If you choose the wrong option, being a US resident, you will not be able to open an account with InstaTrade anyway.
We are sorry for any inconvenience caused by this message.


